 WORLD NEWS VIEW
Antarctic sea ice at third-lowest winter maximum: NASA’s 2026 numbers explained
NASA’s October 12 data show Antarctic winter sea-ice extent peaked at about 17.59 million km² in September 2026. What it means and what it does not.
The facts below are reported as of 13 October 2026; source event dates may be earlier.
Antarctic sea ice reached its winter maximum extent on September 14, 2026, at about 17.59 million square kilometers, according to a NASA Earth Observatory report published on October 12. The measurement ranks as the third-lowest winter maximum in the satellite-era record. The news is scientifically significant because the annual maximum is one of the clearest recurring markers of conditions around Antarctica. It does not mean that all Antarctic ice has vanished, nor should the number be confused with summer minimum extent or the mass of the continent's land-based ice sheet. Each of those measurements describes a different part of the polar environment, and confusing them can make climate headlines more alarming or more reassuring than the evidence warrants.
What NASA actually reported
NASA Earth Observatory described a peak of approximately 17.59 million square kilometers on September 14. The estimate comes from satellite-based observations interpreted with the National Snow and Ice Data Center. The figure counts an area of ocean around Antarctica that meets a commonly used threshold for ice coverage. In practical terms, it represents how far the seasonal sea-ice cover extended at its winter peak rather than a direct measurement of how thick every patch of ice was. Because different ice concentration thresholds and satellite methods can produce slightly different measurements, readers should retain the report's qualification that the peak was likely reached on that date. A precise-looking number is still an estimate within an observational system.
Why Antarctica has a winter maximum and summer minimum
Antarctica is a continent surrounded by ocean. During the Southern Hemisphere's colder months, the sea surface freezes across a broad ring of surrounding waters. As sunlight and temperatures change, much of that floating seasonal ice melts or breaks up during the warmer months. Sea ice generally approaches its greatest area in September and its smallest area around February. This annual cycle is normal. What scientists monitor is how the size, timing and variability of the cycle compare with historical observations. A smaller winter maximum does not mean winter growth stopped altogether; it means the seasonal expansion covered less ocean than is typical in the observational record. Understanding the calendar is essential when comparing different news stories about polar ice.
What “sea-ice extent” means
Sea-ice extent is not the same thing as the volume or mass of ice. NASA's explanation uses an area-based definition: a grid cell of ocean counts toward extent when the estimated ice concentration meets a threshold, commonly at least 15 percent. A measurement made this way can include open water inside a partly ice-covered cell, and a thick sheet of ice and a relatively thin sheet may contribute similar surface area. Scientists also study ice concentration, thickness, age and movement, but these are separate variables. A headline about extent should not be read as a direct statement that 17.59 million square kilometers were covered by solid ice of identical thickness. That would misstate the measurement.
Why “third-lowest” is a meaningful comparison
The satellite record provides a consistent way to compare a large polar region across many years. Ranking a winter maximum near the lower end of that record is a useful signal that 2026 belongs among the years with relatively limited seasonal coverage. However, one ranking cannot by itself describe all causes of the result. Ice around Antarctica responds to wind patterns, ocean conditions, atmospheric circulation and other interacting influences. Scientific interpretation comes from examining trends and physical mechanisms, not from guessing a unique cause for every individual extreme. The report's comparison is important precisely because it is one data point in a longer record that can be studied and rechecked.
How Antarctic and Arctic sea ice differ
The Arctic Ocean is largely surrounded by land, whereas Antarctica is land surrounded by ocean. This contrast shapes the room available for sea ice to spread. Antarctic winter ice can expand into open ocean and later reach warmer waters where it is more likely to melt or be broken up. Arctic sea ice is constrained differently and contains larger areas of ice that can survive from one season to the next. A single graph or percentage taken from the Arctic cannot be transplanted to the Antarctic and treated as equivalent. The two polar regions influence climate, ocean ecosystems and maritime conditions in related but not identical ways. Good reporting names the region and measurement each time.
Does the record show a simple straight-line decline?
NASA's background explains that Antarctic sea ice behaved differently across parts of the satellite era. Between 1979 and roughly 2014, the reported total extent increased slightly on average, although year-to-year variability was substantial. More recent years have included unusually low conditions. This complicated history is a reason to look carefully at long-term charts rather than cherry-picking an individual starting year. It also means simple slogans can fail: an earlier period with a modest increase does not refute subsequent low extremes, and a single unusually low maximum cannot prove the exact trajectory for every future winter. Climate science relies on patterns, methods and uncertainty, not a single dramatic statistic.
What scientists can and cannot infer from one season
A season's maximum is an observation, not a complete explanation. If ocean temperatures, storms or wind transport change, ice can accumulate in a different pattern even when regional climate background conditions are similar. Analysts must consider which mechanisms may have contributed and how they compare with previous years. A useful article therefore separates the new data point from broader conclusions about climate change. The third-lowest ranking is supported by the NASA report; specific claims about the percentage contribution of a particular storm, current or greenhouse-gas forcing would require separate research. WNV does not invent causal shares that the cited report does not provide.
Why the September date matters
The date of the maximum helps researchers compare the timing of seasonal processes. In 2026, NASA's account identifies September 14 as the likely annual peak. That is a historical event date, while the article discussing the measurement was published on October 12. Keeping those dates separate prevents readers from assuming a dramatic ice change occurred overnight on publication day. The agency's reporting calendar reflects the time required to process satellite observations and present contextual information. A responsible headline can be timely without falsely presenting a measured seasonal peak as today's weather emergency. It is also important not to label the October report a new sighting of disappearing land ice.
What satellite images add beyond a number
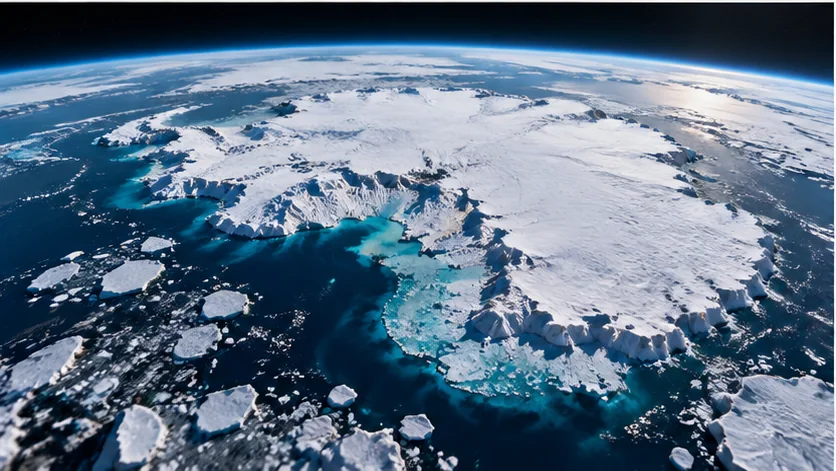
A map helps show where sea ice reached farther into the ocean and where coverage was more limited. NASA's visualizations distinguish more concentrated ice from open water. They also help explain why the same overall area can have different geographic distributions in different years. But an image is not a photograph of every square kilometer at once. It is a scientific representation assembled from sensor data, processing choices and a geographical projection. When news outlets crop or recolor such an image, they should not strip away the source or context that makes the visualization intelligible. WNV uses a clearly labelled AI illustration here instead of presenting synthetic artwork as satellite measurement.
Does less floating sea ice directly raise sea level?
Floating sea ice and grounded ice sheets are different. Ice already floating in seawater does not raise sea level in the same direct way as melting land-based ice that enters the ocean. Nevertheless, changes in sea ice can affect how much sunlight the ocean absorbs, how winds and waves interact with the water, and the conditions around coastal ice shelves. Those indirect relationships matter, but readers should not use the 17.59-million-square-kilometer figure as a calculation of future sea-level rise. To evaluate sea-level change, scientists also monitor ice sheets, glaciers, ocean temperatures and other processes with their own datasets.
Why the result matters for wildlife and marine research
Seasonal sea ice is habitat and a physical influence on food webs. Its timing and distribution can affect access to feeding areas, the growth of sea-ice algae and conditions faced by species adapted to polar seasons. Changes in coverage may also alter research and shipping conditions, although the local consequences differ by place and time. The NASA report does not claim that every Antarctic species experienced the same effect in September 2026. It is more accurate to see this observation as part of a broader environmental context that scientists investigate through biological surveys, ocean observations and satellite measurements. The ice map is a starting point for questions, not a complete ecological impact assessment.
What readers should watch next
The next obvious marker is the Southern Hemisphere summer minimum, typically around February. Researchers will compare how the 2026–27 melt season develops relative to historical records, while also evaluating winds, temperatures and ocean conditions. Updated datasets can refine dates or areas as quality checks continue. Readers should look for a clearly named agency, a stated observation period and an explanation of the measured quantity in any future report. A social-media post showing a dramatic polar image without a source, year or region is not a sufficient basis for concluding that a new record was set. Good ongoing coverage connects comparable measures over time.
How to read a polar climate headline critically
Ask whether the story concerns Antarctic or Arctic ice, and whether it measures a winter maximum, summer minimum, extent, area, thickness or mass. Check if the reported ranking relates to the full satellite record or a shorter comparison. Look for the underlying source and the date observations were made. If the headline claims a single cause, check whether a study supports that attribution or whether it is an assumption. These questions are not designed to reduce concern; they help readers understand why a measurement is significant. Accurate definitions make genuine changes more visible and discourage misleading claims from spreading during viral weather discussions.
Frequently asked questions
What was Antarctica's 2026 winter sea-ice maximum?
NASA Earth Observatory reported an estimated 17.59 million square kilometers, likely reached on September 14, 2026. The agency described it as the third-lowest annual winter maximum in the satellite record.
Did the ice disappear completely?
No. The statistic concerns the area of sea ice at its seasonal maximum, not the disappearance of all Antarctic ice. Floating seasonal ice and land-based ice sheets are separate components of the region.
Why did NASA publish the information in October?
Satellite observations require processing and interpretation. NASA's October 12 report described a maximum likely reached in September. Publication date and observation date should not be confused.
Does this number tell us the exact sea-level change?
No. Sea-ice extent is an area metric for floating ice. Estimating sea-level changes requires additional measurements of land ice, oceans and other processes; the reported extent does not directly provide such a forecast.
Where can readers check the data?
The NASA Earth Observatory report links the measurement to satellite observations and the National Snow and Ice Data Center. Those original sources are better references than an uncaptioned viral map or unverified post.
Sources and verification
Read the original sources to examine the evidence and publication dates.
Related coverage
 AI illustration
D.B. Cooper: the FBI evidence behind America’s 1971 unsolved skyjacking
An evidence-first investigation of the real 1971 D.B. Cooper skyjacking, FBI records, the suspects, the vanished ransom and what remains unknown.
 AI illustration
Dyatlov Pass explained: nine deaths, mountain evidence and the avalanche research
What is documented about the 1959 Dyatlov Pass tragedy, how snow-slab avalanche research works and why unanswered questions remain.
 AI illustration
India’s September inflation reaches 5.54%: food prices and RBI outlook explained
The September 2026 retail inflation rate of 5.54% and food inflation of 7.74% raise questions about household costs and the RBI’s future rate decisions.